Executive summary
Most people learning Business Intelligence are introduced to fact tables and dimension tables within their first few weeks. The definitions are straightforward enough. Fact tables store measurable business events. Dimension tables provide the context needed to analyse those events.
Unfortunately, that simple explanation often creates a false sense of confidence.
In reality, deciding what belongs in a fact table and what belongs in a dimension is one of the most important architectural decisions you will make. Get it right and your reports remain intuitive, performant and scalable for years. Get it wrong and every new report becomes harder to build than the last.
This article goes beyond textbook definitions to explain why this distinction matters, how experienced consultants approach modelling decisions, and the practical questions you should ask before creating your first table.
Imagine a sales director asking a simple question.
"Which customers generated the highest profit last quarter?"
It sounds like a straightforward request. Yet behind that single question sits an entire chain of architectural decisions.
Where is revenue stored?
Where is cost stored?
How do we identify a customer?
What happens if a customer changes region halfway through the year?
How should cancelled orders be treated?
None of these questions have anything to do with visualisations or dashboards. They are questions about the data model itself.
This is why experienced Business Intelligence consultants spend far more time designing models than choosing chart colours. A beautifully designed report cannot compensate for poorly organised data.
Why this decision matters more than most people realise
Many organisations inherit reporting environments that have grown organically over several years. New reports are created to answer immediate business questions, additional fields are added whenever someone requests another filter, and calculations gradually become scattered across dozens of datasets.
At first, everything appears manageable.
Then performance begins to slow.
Different reports return different answers.
Measures become increasingly difficult to understand.
Developers spend more time fixing existing reports than creating new ones.
Eventually, confidence in the reporting platform starts to disappear.
Very rarely is this caused by Power BI, Microsoft Fabric or any other reporting technology. More often, the underlying data model has never been designed around the way the business actually works.
Good architecture simplifies complexity.
Instead of forcing every report author to understand hundreds of database tables, a well-designed semantic model presents information in language the business already understands.
Sales.
Customers.
Products.
Dates.
Employees.
Regions.
Behind the scenes, the architecture may be sophisticated. To the business, however, everything feels simple.
That simplicity is rarely accidental. It is the result of careful modelling decisions made long before anyone opens a dashboard.
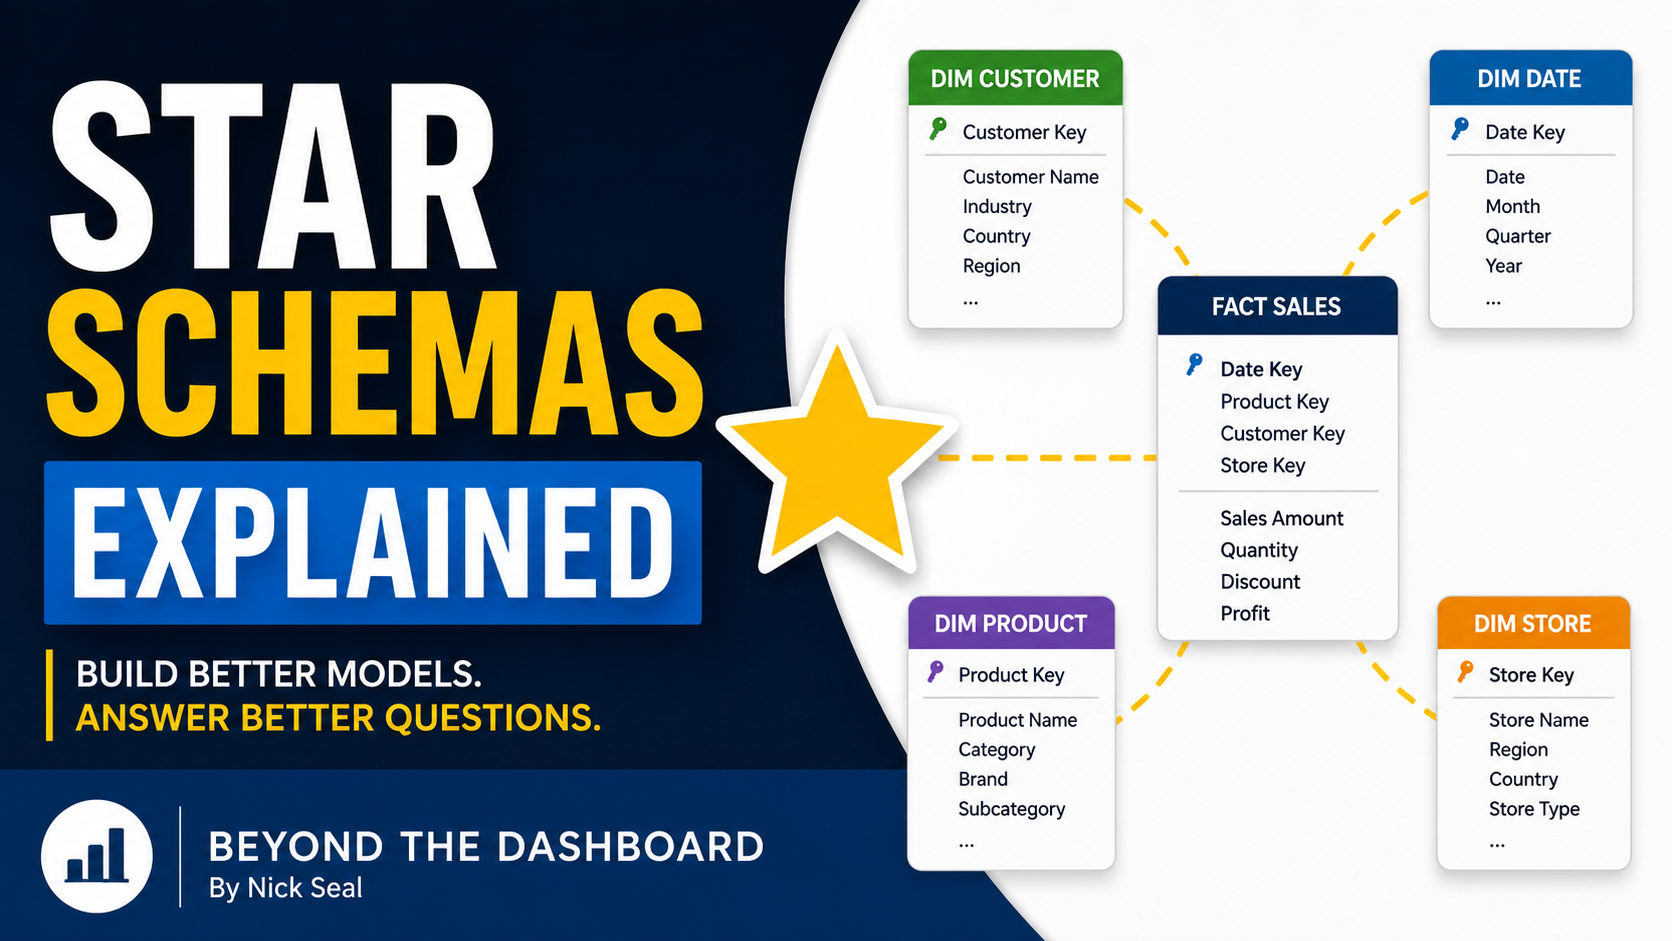
This is one of the reasons the star schema has remained the dominant modelling pattern for analytical systems for decades.
Technologies have evolved dramatically. Cloud platforms have replaced on-premises servers. Lakehouses have emerged alongside traditional data warehouses. Semantic models have become increasingly sophisticated.
Yet the fundamental principle has not changed.
Separate the measurable events from the descriptive information.
Everything else becomes easier.
The quality of a dashboard is determined long before the first visual is created.
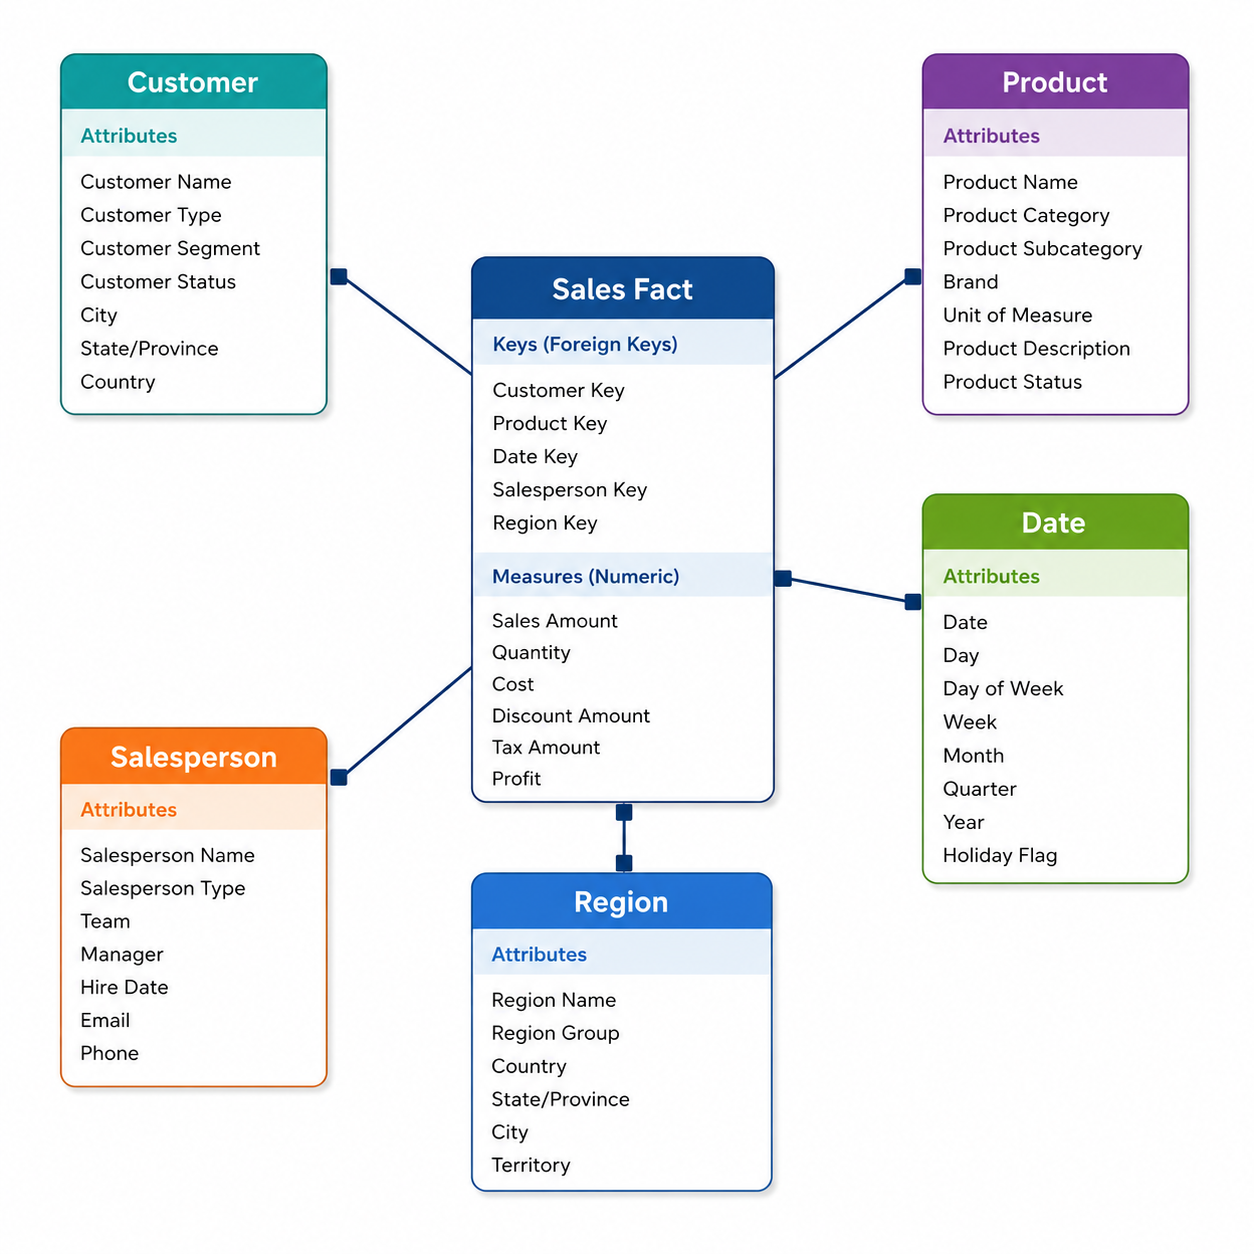
A clean editorial illustration showing a central Sales Fact table connected to surrounding dimension tables labelled Customer, Product, Date, Salesperson and Region. The fact table contains numerical measures while the dimensions contain descriptive business attributes. Use a Microsoft-inspired colour palette with a white background, subtle gradients and a modern architectural style suitable for a professional Business Intelligence publication.
Understanding fact tables
- Fact Table
- A fact table stores measurable business events at a defined level of detail, known as the grain. Each row represents something that happened, while numeric measures record what can be counted, summed or analysed.
If dimension tables answer the question "who, what, where and when?", fact tables answer "what happened?"
Every business generates facts.
A retailer records purchases.
A hospital records appointments.
A recruitment agency records placements.
A manufacturer records production runs.
An airline records completed flights.
These are all business events that occur over time and produce measurable outcomes.
The role of the fact table is to capture those outcomes accurately and consistently.
One of the biggest misconceptions among new data modellers is that fact tables simply store numbers.
They do much more than that.
A fact table represents the business process itself.
Consider an online order.
The total order value is certainly important, but so are the relationships surrounding it.
Which customer placed the order?
Which products were purchased?
When did the transaction occur?
Which sales representative managed the account?
Which warehouse fulfilled the shipment?
The numerical measures only become meaningful because every row links to the business context held elsewhere in the model.
This design also explains why fact tables often become extremely large.
A national retailer may process millions of transactions every month.
A manufacturing company may collect billions of machine readings each year.
An organisation using IoT sensors may generate new events every second.
Fact tables grow because businesses continue operating.
Dimension tables grow much more slowly because customers, products and organisational structures change far less frequently than daily transactions.
Recognising this difference is fundamental to designing scalable analytical systems.
Business Process | Typical Fact Table | Common Measures |
|---|---|---|
Retail Sales | Sales Fact | Sales Amount, Quantity, Discount, Profit |
Recruitment | Placement Fact | Margin, Fee, Placement Count |
Manufacturing | Production Fact | Units Produced, Scrap Quantity, Downtime |
Finance | General Ledger Fact | Debit, Credit, Balance |
Healthcare | Appointment Fact | Appointment Count, Duration, Cost |
Logistics | Shipment Fact | Weight, Distance, Delivery Time |
Why dimensions deserve just as much attention
It is tempting to think of dimension tables as supporting actors while the fact table takes centre stage. In reality, the opposite is often true. A business user rarely asks to analyse "Fact Row 4,298,117". They ask about customers, consultants, products, departments, locations and dates.
Those business entities live inside dimension tables, and the quality of those dimensions determines whether analysis feels natural or frustrating.
In the next part, we will explore how dimension tables provide business meaning, why attributes are just as valuable as measures, and how the relationship between facts and dimensions forms the foundation of every effective star schema.
Understanding dimension tables
- Dimension Table
- A dimension table stores descriptive information about the people, places, products, dates and other business entities involved in a business process. Rather than measuring events, dimensions provide the context needed to interpret and analyse those events.
If fact tables tell you what happened, dimension tables explain who it happened to, what it involved, where it occurred and when it took place.
They transform raw transactions into meaningful business information.
Imagine receiving nothing more than the following row of data.
CustomerKey | ProductKey | DateKey | SalesAmount |
|---|---|---|---|
1057 | 42 | 20260115 | £1,245.00 |
On its own, this tells us very little.
Now imagine those keys linking to dimensions.
Customer 1057 becomes Acme Manufacturing Ltd.
Product 42 becomes Industrial Safety Helmet.
Date 20260115 becomes 15 January 2026, within Q2 FY2026.
The transaction has not changed, but its business value has increased dramatically.
This is exactly what dimension tables achieve.
Dimensions also provide the language of the business.
When executives discuss performance, they rarely refer to IDs or database fields. They talk about customers, consultants, offices, departments, product categories, market sectors and financial periods.
A good semantic model reflects that language naturally.
If users need training simply to understand your field names, the model is already working against them.
Dimension | Typical Attributes |
|---|---|
Customer | Name, Industry, Account Manager, Region, Customer Type |
Product | Product Name, Category, Brand, Size, Colour |
Employee | Name, Department, Job Title, Manager |
Consultant | Consultant Name, Team, Office, Recruitment Type |
Date | Day, Week, Month, Quarter, Financial Year |
Supplier | Supplier Name, Country, Supplier Category |
How facts and dimensions work together
A star schema is successful because each table has a single responsibility.
Fact tables record measurable business activity.
Dimension tables describe the business entities involved.
This separation may seem obvious, yet it solves several architectural problems simultaneously.
Storage becomes more efficient because descriptive information is stored once instead of repeated millions of times.
Business terminology remains consistent across reports.
Calculations become simpler.
Relationships are easier to understand.
Most importantly, users can ask new questions without redesigning the model.
Flat reporting table
- Customer name repeated millions of times
- Product category duplicated on every transaction
- Difficult to update descriptive information
- Larger storage requirements
- Greater risk of inconsistent values
- Harder to maintain
Star schema
- Customer stored once
- Product stored once
- Reusable descriptive attributes
- Smaller overall model
- Consistent business definitions
- Easier to extend over time
Consider a customer changing their company name.
In a poorly designed reporting table, that name might appear hundreds of thousands of times. Updating every occurrence is expensive, increases the risk of inconsistencies and often requires a full reload.
In a dimensional model, the descriptive information usually exists in a single row within the customer dimension. Reports automatically display the updated name while the historical transactions remain linked to the same customer.
One small architectural decision eliminates an entire class of maintenance problems.
Fact tables measure the business. Dimension tables describe the business. Together they tell the complete story.
Choosing the correct grain
- Grain
- The grain of a fact table defines exactly what a single row represents. Every measure and every relationship within that table must be consistent with that level of detail.
If there is one concept that separates experienced data modellers from beginners, it is grain.
Before adding a single column to a fact table, you should be able to complete the following sentence.
One row represents...
Until that sentence is clear, the design is not ready.
Perhaps one row represents an invoice line.
Perhaps it represents a completed placement.
Perhaps it represents a consultant's daily activity.
Whatever the answer, every row must follow that same definition.
Imagine a recruitment business.
You may have several possible grains.
- One row per placement.
- One row per placement invoice.
- One row per consultant activity.
- One row per candidate application.
- One row per job advertisement.
Each supports different analytical questions.
Trying to combine all of them into one fact table almost always creates confusion.
Common modelling mistakes
Most modelling problems are not caused by technology.
They are caused by uncertainty about the business.
When developers work directly from source systems, there is a temptation to reproduce the operational database inside the reporting layer. Every table is imported, every relationship is preserved and the reporting tool is expected to solve the complexity.
The result is a model that mirrors the application rather than the questions the business wants answered.
Operational systems are designed to run the business.
Analytical models are designed to understand it.
Those are fundamentally different objectives.
Common Mistake | Consequence | Better Approach |
|---|---|---|
Using operational tables directly | Complex reports and poor usability | Build a dimensional model |
Mixing facts and descriptive attributes | Difficult maintenance | Separate facts from dimensions |
Multiple grains in one fact | Incorrect totals | Create separate fact tables |
Storing calculations everywhere | Inconsistent answers | Centralise business measures |
Creating relationships without business meaning | Confusing navigation | Model real business processes |
Another frequent mistake is treating every source column as equally important.
In reality, many operational fields exist solely to support the application.
Temporary status flags.
Audit columns.
Processing timestamps.
Internal identifiers.
These may be essential for running the software but add little value to analytical reporting.
Experienced consultants do not ask, "Can we import this column?"
They ask, "Will the business ever use it to make a better decision?"
That single question often removes hundreds of unnecessary fields before the semantic model is even published.
The star schema is simple by design
It is easy to mistake simplicity for a lack of sophistication.
A well-designed star schema often contains surprisingly few tables. That is not because the underlying business is simple, but because the complexity has been carefully organised.
Experienced architects spend considerable effort deciding what not to include.
Every additional table, relationship and column increases cognitive load for report authors. Every unnecessary field makes it slightly harder to find the one that matters.
The objective is not to model everything.
It is to model everything the business needs to answer its questions accurately and consistently.
That discipline is one of the defining characteristics of mature Business Intelligence architecture.
Building a model that lasts
The distinction between fact tables and dimension tables is more than a modelling convention. It is an architectural principle that has remained relevant through decades of technological change.
Whether your data ultimately resides in a traditional warehouse, a lakehouse, Microsoft Fabric or another modern analytical platform, the same principles continue to apply.
Business events belong in fact tables.
Business entities belong in dimension tables.
The challenge is not remembering those definitions. It is applying them consistently as new requirements emerge, new source systems are introduced and organisations evolve.
In the final part of this article, we will bring these ideas together into a practical design checklist, answer common questions and explore the habits that distinguish robust semantic models from those that gradually become difficult to maintain.
A practical checklist for every new fact table
- Can you clearly state what one row represents?
- Does every row belong to a single business process?
- Are all measures recorded at the same level of detail?
- Have descriptive attributes been moved into dimensions where appropriate?
- Can users answer common business questions without complex calculations?
- Are relationships based on meaningful business entities rather than technical identifiers?
- Will the model still make sense if the source system changes?
- Have unnecessary operational fields been removed?
- Does the naming reflect business terminology rather than database terminology?
- Could another developer understand the model without additional documentation?
"Data models should make the business easier to understand, not the database."
Final thoughts
Every Business Intelligence project eventually reaches the same point.
The dashboards are ready.
The measures have been written.
The stakeholders begin asking new questions.
This is where the quality of the data model is truly tested.
If the model has been built around well-defined fact tables and carefully designed dimensions, those new questions are usually straightforward to answer. New reports can be developed quickly because the underlying architecture already reflects how the business operates.
If the model has grown organically without a clear separation of facts and dimensions, every additional requirement becomes progressively more difficult. Developers duplicate logic, reports begin to contradict one another and confidence in the data starts to decline.
The difference rarely comes down to technology.
It comes down to architecture.
One lesson becomes increasingly obvious with experience.
Business users rarely ask for new tables.
They ask for new insight.
Good modelling allows those insights to emerge naturally because the business processes have already been organised into a structure that is intuitive, consistent and scalable.
That is why experienced consultants spend so much time discussing grain, business processes and dimensional modelling before writing a single DAX measure.
They understand that reports are temporary.
A well-designed data model becomes a long-term business asset.
Understanding the difference between fact tables and dimension tables is often presented as an introductory topic in Business Intelligence.
In reality, it is a subject that experienced architects continue refining throughout their careers.
Every new project introduces different business processes, different operational systems and different analytical requirements. The underlying principles remain remarkably consistent.
Capture business events accurately.
Describe those events with meaningful dimensions.
Keep responsibilities clear.
Build around the language of the business.
Do those things well and every dashboard built on top of the model becomes easier to develop, easier to maintain and easier to trust.
Frequently asked questions
What is the difference between a fact table and a dimension table?
Can a star schema contain multiple fact tables?
Why shouldn't descriptive fields be stored in a fact table?
What does grain mean in data modelling?
Are star schemas still relevant with Microsoft Fabric and modern lakehouses?
Should every operational table become part of the semantic model?
Is a date table really necessary?
Key takeaways
- Fact tables capture measurable business events.
- Dimension tables provide the descriptive context needed to analyse those events.
- Always define the grain before designing a fact table.
- Keep one business process per fact table.
- Design models around business terminology rather than source systems.
- Star schemas remain the preferred modelling approach for analytical reporting.
- Good architecture reduces report complexity and improves long-term maintainability.
- Semantic models should simplify the business, not expose database complexity.