Executive summary
Almost every organisation has one.
A spreadsheet that began life as a temporary solution before quietly becoming essential to the business.
It calculates commission, forecasts revenue, tracks profitability, reconciles finance, measures performance or produces reports for senior leadership. Everyone trusts it because it has always been there.
The problem is not that spreadsheets are inherently bad. They remain one of the most flexible tools ever created for analysing data. The danger begins when a spreadsheet becomes a business system without anyone realising it.
Over the years I have seen spreadsheets used to bridge gaps between disconnected systems, validate complex reports and satisfy urgent requests that could not wait for a proper solution. Many delivered genuine value. Some remained in use for years after the original problem had disappeared.
This article explores why organisations become dependent on spreadsheets, the risks that often remain hidden until something goes wrong, and why modern business intelligence should complement spreadsheets rather than simply replace them.
One conversation has stayed with me throughout my career.
A senior manager proudly explained that the organisation's most important weekly report had never failed. Every Monday morning the same workbook was opened, refreshed, checked and emailed across the business. Directors relied on it. Operational teams planned their week around it. Finance referenced it during performance reviews.
When I asked who understood how it worked, the room became noticeably quieter.
Eventually someone smiled and said, "Only Karen."
Karen had built it years earlier.
She knew which tabs should never be touched, which formulas occasionally needed fixing after new data arrived, and which warnings could safely be ignored because "they always happen".
Nothing about that situation was unusual.
In fact, it is remarkably common.
The names change, the departments change and the purpose changes, but the story rarely does.
Why spreadsheets become business critical
Very few organisations deliberately decide to build critical business processes around spreadsheets.
Instead, they evolve naturally.
A reporting request arrives that cannot be delivered quickly enough through existing systems. Someone exports data, applies a few formulas and shares the result. The report proves useful, so it is used again next week.
Then another calculation is added.
Another worksheet appears.
Someone introduces conditional formatting to highlight exceptions.
A lookup table is created to translate department names.
Months later, the spreadsheet has become the reporting process.
Nobody planned for it to happen. It simply became the easiest way to solve a series of short-term problems.
This is one of the reasons spreadsheets are so successful.
They allow experienced business users to answer questions without waiting for developers, database administrators or BI teams.
That flexibility creates enormous value.
It also creates invisible technical debt.
Unlike properly engineered reporting platforms, spreadsheets rarely have formal testing, version control, documentation or governance. Every new formula introduces another opportunity for inconsistency. Every manual adjustment relies on someone remembering exactly what they changed last month.
The spreadsheet continues to work until one small change unexpectedly breaks everything.
During my own work in business intelligence, I have frequently used spreadsheets as part of the investigative process.
When validating a Power BI report against a legacy process, Excel is often the quickest way to compare datasets, isolate discrepancies or prove whether an issue exists in the source data rather than the semantic model.
There is nothing wrong with that.
The important distinction is that the spreadsheet supports the investigation rather than becoming the permanent reporting solution.
That difference is subtle, but significant.
"The biggest risk is rarely the spreadsheet itself. It is when the business quietly starts treating the spreadsheet as a system."
Trust is earned long before risk appears
One of the reasons spreadsheet risk is so difficult to identify is because successful spreadsheets build confidence over time.
If a report has produced consistent numbers every week for three years, people naturally begin to trust it.
Eventually they stop questioning it altogether.
That confidence often extends beyond the spreadsheet itself. New reports are compared against it. Dashboards are validated against it. Decisions are challenged if they disagree with it.
Ironically, many modern BI projects begin by proving they can match figures produced by an ageing workbook that nobody fully understands.
I have experienced this myself when introducing new reporting solutions. Before stakeholders are willing to trust a dashboard, they understandably want reassurance that it agrees with the process they have relied on for years. Building that confidence is an important part of any successful migration.
Sometimes that validation exercise uncovers genuine issues in the new solution.
Other times it reveals assumptions that have quietly accumulated inside the spreadsheet over many years.
Perhaps a hidden worksheet excludes a particular business unit.
Perhaps someone hard-coded a value during a busy month and forgot to remove it.
Perhaps an employee left years ago after creating a formula that nobody else has ever reviewed.
None of these situations suggest poor practice by the individuals involved.
Most were solving real business problems under real business pressures.
The concern is that those solutions often outlive both the original problem and the people who created them.
- Spreadsheet-driven reporting
- A reporting process where spreadsheets become the primary mechanism for collecting, transforming, calculating or presenting business information instead of acting as temporary analysis tools. Over time, these spreadsheets often evolve into unofficial business systems despite lacking the controls, governance and resilience expected of production reporting platforms.
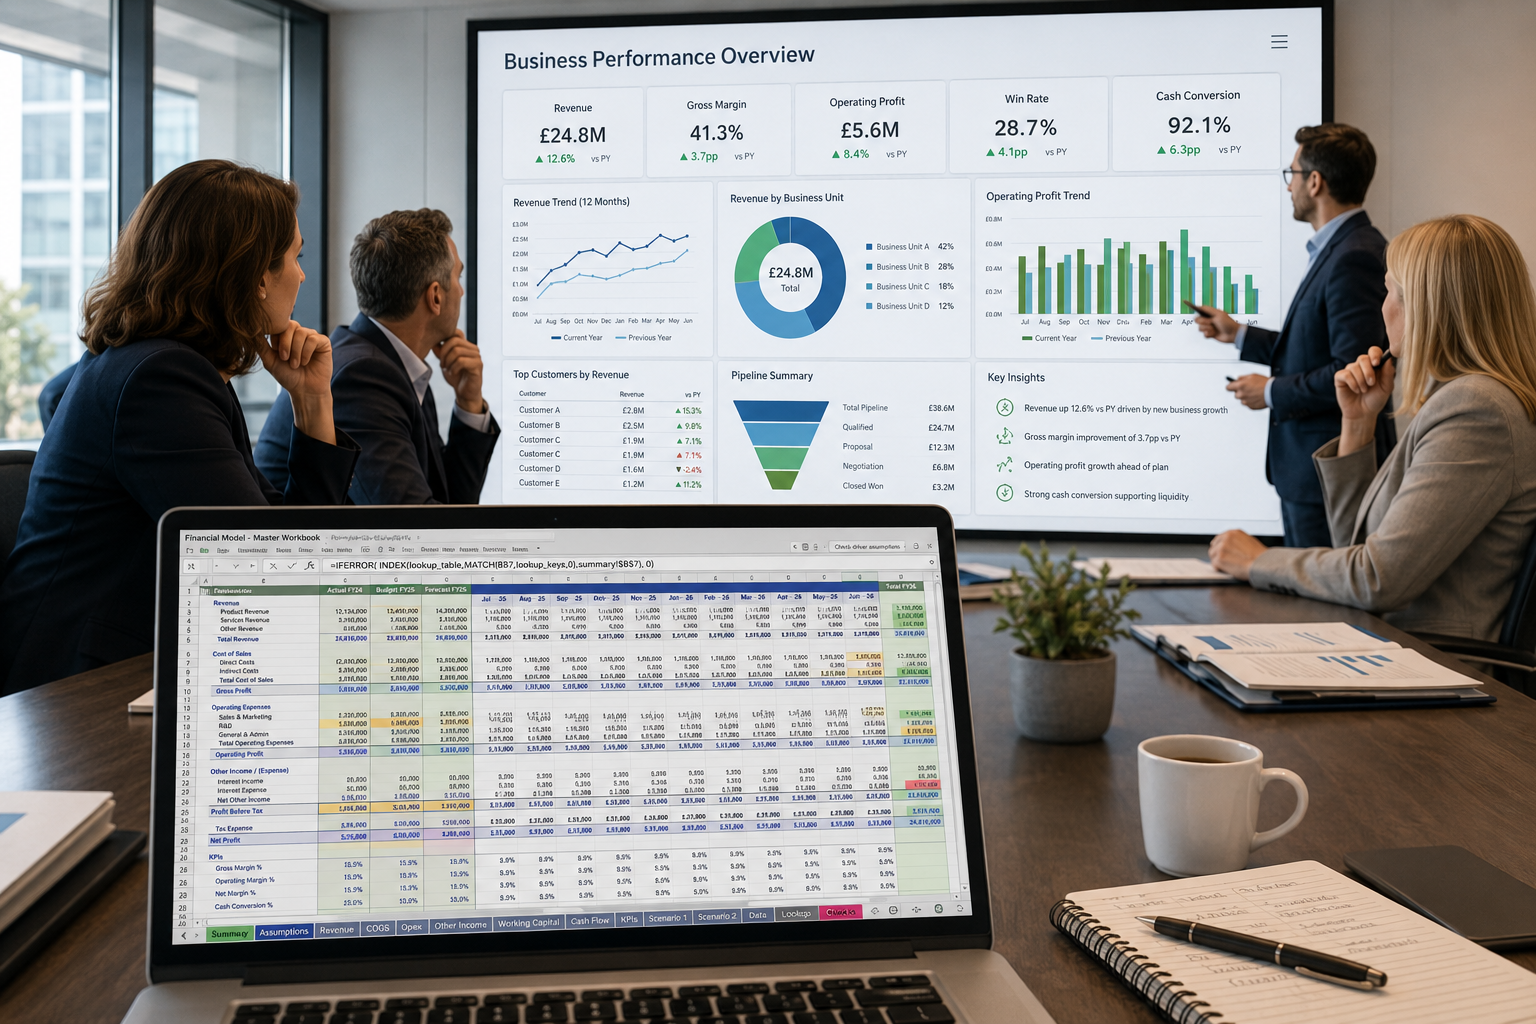
A modern office meeting room where senior leaders are reviewing financial and operational KPIs projected onto a large screen. On one side of the room, a single laptop displays a complex Excel workbook with dozens of worksheets and colour-coded tabs. Subtle visual cues show that the workbook is acting as the hidden engine behind the executive dashboard. The atmosphere should convey confidence on the surface but underlying fragility.
How spreadsheet risk creeps in without anyone noticing
The biggest spreadsheet failures rarely begin with a dramatic mistake.
They begin with success.
The workbook answers an important business question. People like the report. More requests follow. New tabs appear. Additional calculations are introduced. A few manual adjustments are needed to accommodate exceptions.
Every individual change makes perfect sense.
Collectively, they create something that nobody intended to build.
This gradual evolution is what makes spreadsheet-driven reporting so difficult to recognise. There is no project plan, no architecture review and no formal handover. The spreadsheet simply grows alongside the business until it becomes indispensable.
What makes this particularly challenging is that spreadsheets are incredibly forgiving.
They rarely stop working altogether.
Instead, they continue producing results, even when the underlying logic has become increasingly complex. A formula copied one row too far may only affect one department. A lookup table might not include the latest product codes. A new business unit may never be added to a hidden worksheet because nobody remembers that it exists.
The report still arrives on Monday morning.
The numbers still look believable.
That is often enough.
The hidden dependency problem
One lesson I have learnt throughout my career is that businesses rarely depend on technology alone.
They depend on people.
I have encountered reporting processes where one person knew exactly which filters to apply before exporting data. Another remembered that a CSV file needed to be opened in a particular way to avoid date formatting issues. Someone else knew that a formula had to be copied down after every system upgrade.
None of those steps were documented because they had become routine.
When those individuals were on annual leave, changed roles or left the organisation, the reporting process suddenly became far more fragile than anyone had realised.
That is not a spreadsheet problem.
It is a knowledge management problem that spreadsheets often expose.
This is one reason I place so much emphasis on documentation when delivering reporting solutions.
A semantic model should not depend on the person who built it.
A Power BI report should not require a particular developer to explain every measure.
Likewise, a business-critical calculation should never exist only in somebody's memory.
Technology changes.
People change.
Good architecture allows both to happen without disrupting the business.
"If a report only works when one specific person is available, the organisation has a resilience problem, not a reporting problem."
When spreadsheets become the source of truth
One pattern appears repeatedly in reporting projects.
A new dashboard is developed using data directly from operational systems. During testing, stakeholders compare the results with an established spreadsheet that has been used for years.
The numbers do not match.
The immediate assumption is often that the dashboard is wrong.
Sometimes it is.
More often, the investigation uncovers subtle differences in business logic that have accumulated over time.
Perhaps the spreadsheet excludes cancelled orders.
Perhaps it rounds figures differently.
Perhaps a manual adjustment was introduced years ago after a one-off issue and quietly became part of the monthly process.
Nobody is deliberately manipulating the data.
The business has simply become accustomed to the spreadsheet's interpretation of reality.
I have spent many hours validating reports against legacy spreadsheets before stakeholders were comfortable adopting a new reporting platform.
Those exercises were never wasted effort.
They often revealed valuable business rules that had never been documented anywhere else.
Equally, they occasionally uncovered calculations that no longer reflected how the organisation actually operated.
Migration is not just about reproducing existing reports.
It is about understanding why those reports evolved in the first place.
Week one
Data exported to answer a one-off business question.
Month 1
Spreadsheet reused because it saves time.
Month 6
Additional calculations and manual adjustments are added.
Year 1
Multiple teams rely on the workbook.
Year 3
Original author has moved on but the spreadsheet remains essential.
Year 5
Organisation believes the spreadsheet is the definitive source of truth.
Spreadsheet-led reporting
- Business rules hidden inside formulas
- Manual refreshes
- Multiple versions in circulation
- Knowledge held by individuals
- Difficult to audit
- High reliance on manual checking
- Changes rarely documented
Modern BI reporting
- Business rules held in semantic models
- Automated refreshes
- Single governed version
- Shared organisational knowledge
- Auditable calculations
- Consistent definitions
- Controlled change management
1
Single point of failure
Many spreadsheet-driven reporting processes ultimately rely on one workbook, one author or one undocumented process. Removing any one of those can disrupt reporting far more than most organisations expect.
Characteristic | Temporary Analysis | Business-Critical Reporting |
|---|---|---|
Primary purpose | Investigate data | Inform business decisions |
Typical owner | Individual analyst | Organisation |
Version control | Usually informal | Essential |
Documentation | Helpful | Mandatory |
Refresh process | Manual is acceptable | Should be automated where possible |
Validation | Personal confidence | Independent verification |
Audit trail | Limited | Expected |
Long-term suitability | High | Low without governance |
What good looks like
Reducing spreadsheet risk does not mean banning spreadsheets.
In fact, some of the most effective analysts I have worked with are exceptionally skilled Excel users.
The goal is not to eliminate flexibility.
The goal is to ensure that flexibility exists at the right stage of the reporting process.
Spreadsheets are excellent for exploring data, testing ideas and answering questions that may never be asked again.
Once a report becomes part of regular operational decision making, however, the underlying business logic deserves a more resilient home.
That is where modern business intelligence platforms provide genuine value.
Rather than embedding calculations inside dozens of workbooks, organisations can centralise business rules within governed semantic models, automate data preparation and give everyone access to consistent definitions.
The result is not fewer spreadsheets.
It is fewer spreadsheets carrying responsibilities they were never designed to hold.
By the time a report reaches a director's desk, the conversation should focus on what the data means, not whether the workbook was refreshed correctly.
Moving beyond spreadsheet dependency
Organisations rarely wake up one morning and decide to replace every spreadsheet.
Nor should they.
Spreadsheets remain one of the most productive tools available to analysts, finance teams and operational managers. They encourage exploration, support rapid analysis and allow people to answer questions quickly.
The objective is not to eliminate Excel from the organisation.
The objective is to understand where the line should be drawn.
A spreadsheet used by an analyst to investigate an unexpected trend is a valuable tool.
A spreadsheet that determines quarterly revenue, executive bonuses or board reporting deserves the same level of governance as any other production system.
Recognising that distinction is often the first step towards a more resilient reporting landscape.
In my experience, the most successful reporting transformations have not started with technology.
They have started by asking a simple business question.
"What decisions depend on this report?"
Once that question is answered, the priorities become much clearer.
If an inaccurate report could delay recruitment, affect financial forecasting or influence strategic decisions, the reporting process deserves investment. If the report simply helps an individual organise their own workload, a spreadsheet may remain entirely appropriate.
The importance of the decision should determine the maturity of the reporting solution.
- Identify reports that influence financial or operational decisions.
- Record where business rules currently exist.
- Document manual steps before attempting automation.
- Remove reliance on individual knowledge wherever possible.
- Create a single governed source for shared KPIs.
- Validate new reporting against trusted source systems rather than assumptions.
- Keep spreadsheets for analysis, not as long-term reporting platforms.
- Review business-critical reports regularly as organisational processes evolve.
"Excel is one of the greatest business tools ever created. Problems arise when we expect it to behave like an enterprise reporting platform."
One of the most rewarding parts of delivering business intelligence projects is watching confidence shift.
Initially, stakeholders ask whether the new dashboard matches the spreadsheet.
A few months later, they begin asking new questions because they trust the underlying data.
That is the real value of modern reporting.
It is not simply producing charts more quickly.
It is allowing people to spend less time validating numbers and more time understanding what those numbers are telling them.
The real cost of the million pound spreadsheet
Despite the title of this article, the value of the spreadsheet itself is rarely measured in pounds.
The cost comes from the decisions built upon it.
An inaccurate forecast may influence hiring plans.
A delayed operational report may affect customer service.
An inconsistent KPI may cause teams to focus on the wrong priorities.
None of these outcomes require a catastrophic spreadsheet error.
They simply require the wrong information to reach the right people at the wrong time.
That is why reporting deserves to be treated as business infrastructure rather than administrative overhead.
The irony is that many spreadsheets represent remarkable ingenuity.
They were created by people solving genuine business problems with the tools they had available.
Those individuals deserve recognition, not criticism.
The responsibility now lies with organisations to capture that knowledge, formalise it where appropriate and ensure it can continue supporting the business without depending on a single workbook or a single individual.
Technology evolves.
Businesses evolve.
Good reporting should evolve with them.
Frequently asked questions
Are spreadsheets bad for business reporting?
Should every spreadsheet be replaced with Power BI?
Why do organisations continue using legacy spreadsheets?
What is the biggest risk with spreadsheet-driven reporting?
How can organisations reduce spreadsheet risk?
Does moving to Power BI automatically solve governance issues?
Should spreadsheets still be part of a BI team's toolkit?
Key takeaways
- Spreadsheets become risky through gradual evolution rather than deliberate design.
- Most spreadsheet-driven reporting begins as a sensible short-term solution.
- Hidden business rules often live inside workbooks instead of organisational documentation.
- Dependency on individuals creates greater risk than dependency on technology.
- Modern BI should centralise shared business logic while preserving analytical flexibility.
- The importance of a report should determine the maturity of the reporting solution.
- Trust should come from governed data, not familiarity with a spreadsheet.
- The best reporting environments combine strong governance with flexibility for analysis.