Executive summary
If you've ever looked at a Power BI model and wondered why experienced developers insist on talking about star schemas, you're not alone.
At first glance, a star schema can appear overly simplistic. After all, modern databases are capable of storing thousands of interconnected tables. Why deliberately reduce everything to a handful of dimensions surrounding a single fact table?
The answer is surprisingly straightforward.
Star schemas are designed for answering business questions, not running operational systems.
By organising data around business events, they produce reports that are easier to understand, easier to maintain and significantly faster to query. They also encourage consistent definitions across an organisation, reducing the number of debates over which report is correct.
This article explains the concept from first principles. Whether you're a business stakeholder trying to understand why your data team keeps talking about dimensional modelling, or a Power BI developer looking to strengthen your foundations, you'll gain a practical understanding of why star schemas remain the industry standard.
Imagine walking into a large supermarket.
Every shelf has been organised so customers can quickly find what they need. Fruit sits with fruit. Dairy products are together. Frozen food lives in its own aisle. You don't have to understand the logistics behind the scenes to appreciate that the layout has been designed to make shopping efficient.
Now imagine the opposite.
Instead of organised aisles, every product arrives directly from suppliers and is placed wherever there happens to be space. Milk could sit next to washing powder. Apples might be beside batteries. Finding anything becomes frustrating.
Many reporting solutions resemble that second supermarket.
Operational systems are built to capture transactions efficiently. Reporting systems are built to answer questions efficiently. Those are two very different objectives.
A star schema is one of the simplest ways of reorganising operational data into something people can actually analyse.
"The purpose of a star schema isn't to store data. It's to make answering business questions as simple as possible."
What is a Star Schema?
- Star Schema
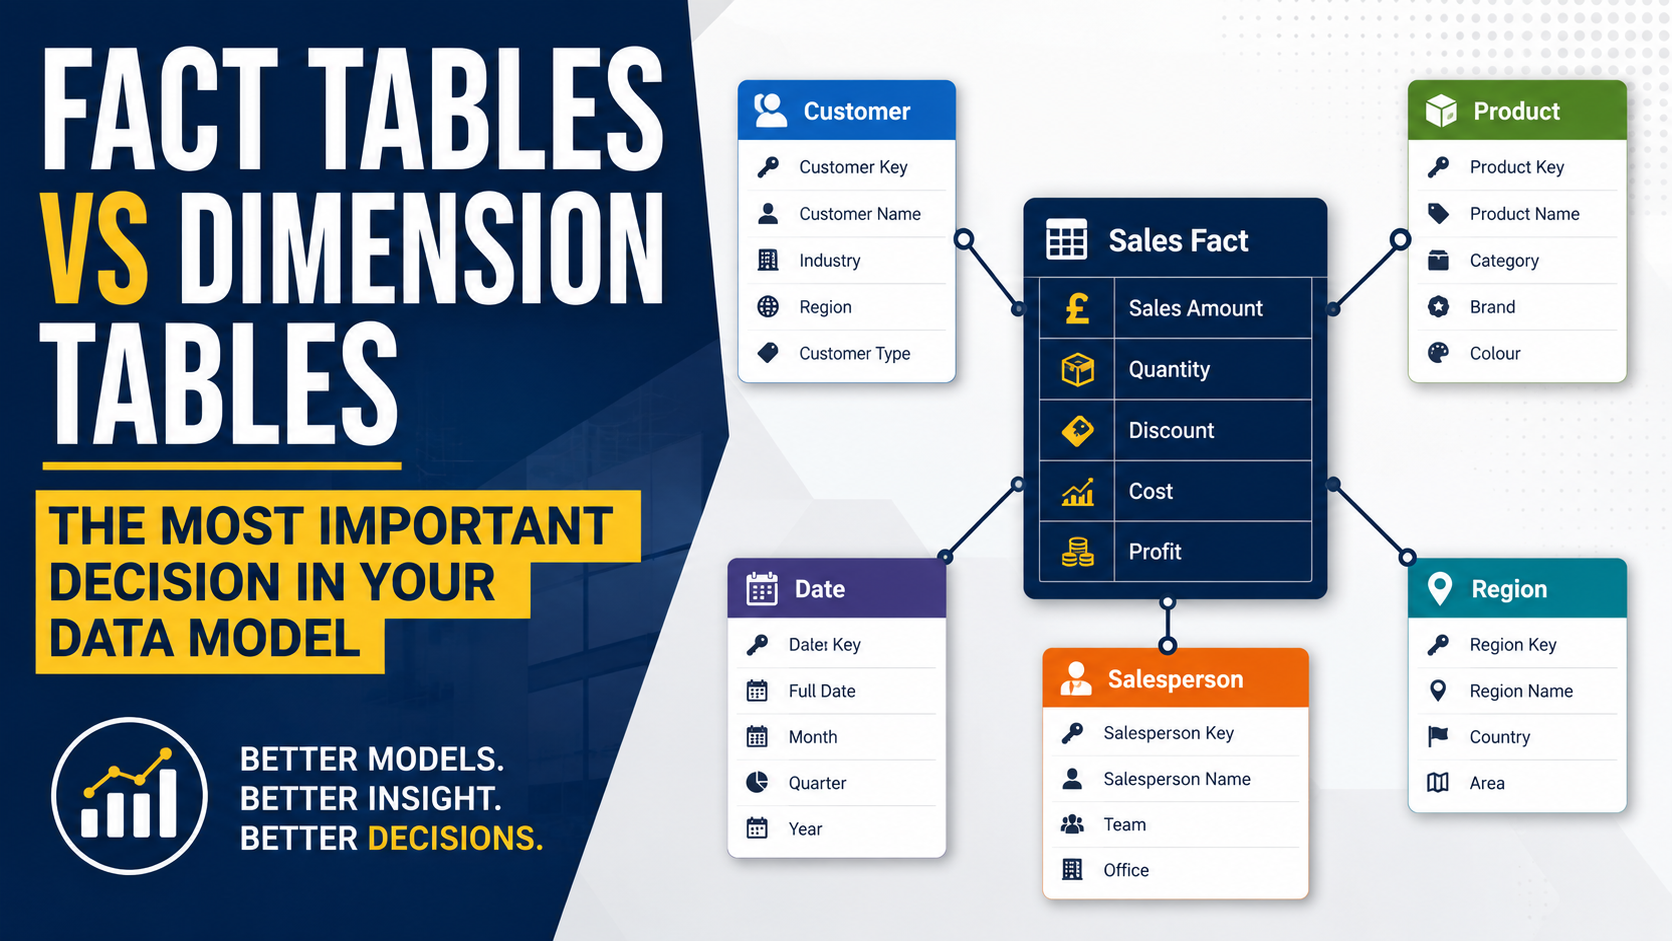
- A star schema is a data model where a central fact table containing measurable business events is surrounded by dimension tables that describe those events. Its structure resembles a star, giving the modelling approach its name.
Despite the impressive sounding name, there's nothing particularly complicated about a star schema.
Imagine your organisation wants to analyse sales.
Every time a customer buys something, a sale occurs. That sale becomes a single record inside a fact table.
Around that sale are pieces of descriptive information.
Who bought it?
Which product was sold?
Which salesperson handled the order?
Which branch made the sale?
What date did it happen?
Each of those descriptions belongs in its own dimension table.
Rather than repeating customer names, product descriptions or branch addresses millions of times, the fact table simply stores references to those dimensions.
The result is a model that's smaller, cleaner and considerably easier to analyse.
The reason this design works so well is because businesses naturally think in terms of events and descriptions.
When a director asks, "How much revenue did we generate in London last quarter?", they're combining a measurable event with descriptive attributes.
Revenue comes from the fact table.
London comes from a location dimension.
Last quarter comes from a calendar dimension.
The star schema mirrors the way decision-makers naturally ask questions.
Why Do Organisations Use Star Schemas?
One of the biggest misconceptions in Business Intelligence is that star schemas exist purely because database professionals prefer them.
That couldn't be further from the truth.
They exist because organisations need consistent answers.
Consider something as simple as monthly revenue.
If five departments build five reports directly against an operational database, each team may interpret the data slightly differently.
One report excludes cancelled orders.
Another includes refunds.
A third uses invoice dates rather than order dates.
Each report might be technically correct according to its own rules, yet all produce different numbers.
Trust begins to disappear.
A well-designed star schema establishes a single version of the business event. Everyone analyses the same facts using the same dimensions, dramatically reducing conflicting interpretations.
Performance is another significant advantage.
Operational databases are highly normalised. Information is deliberately split across many related tables to minimise duplication and support thousands of users creating, updating and deleting records simultaneously.
Analytical workloads are completely different.
Reports often need to aggregate millions of rows across months or years of history.
A star schema dramatically reduces the number of joins required to answer those questions, allowing analytical engines such as Power BI, Microsoft Fabric and SQL Server Analysis Services to optimise queries far more effectively.
This isn't simply about making reports load faster.
It's about enabling people to explore data interactively without waiting for every click to return results.
There's another benefit that's often overlooked.
Communication.
When someone joins a Business Intelligence team, they should be able to understand the data model without reading hundreds of pages of documentation.
A star schema is largely self-explanatory.
Sales connect to customers.
Customers connect to geography.
Products belong to categories.
Dates belong to calendars.
Even people without a technical background can usually follow the relationships after only a few minutes.
That clarity becomes increasingly valuable as organisations grow and more people begin creating reports.
Operational System
- Designed to record business transactions
- Highly normalised
- Frequent inserts and updates
- Optimised for accuracy and consistency
- Hundreds of interconnected tables are common
- Built for running the business
Star Schema
- Designed for analysis
- Intentionally simplified
- Optimised for reading data
- Easy for reporting tools to understand
- Minimal joins
- Built for understanding the business
The Two Building Blocks Every Star Schema Needs
Every star schema, regardless of whether it supports finance, sales, recruitment, manufacturing or healthcare, is built from just two fundamental components.
Facts describe something that happened.
Dimensions describe the context surrounding what happened.
Understanding this distinction is one of the biggest milestones in becoming confident with data modelling.
In the next section, we'll explore both in detail, uncovering why experienced data architects spend far more time defining business events than creating tables, and why getting this foundation right has such a profound impact on reporting quality, performance and long-term maintainability.
Fact Tables: Capturing What Happened
Every organisation exists because something happens.
A customer places an order.
A candidate is hired.
A patient attends an appointment.
A machine produces a component.
An invoice is paid.
These business events are what analysts spend most of their time measuring. They are the heartbeat of reporting, and they belong in a fact table.
A fact table is often described as the centre of a star schema, but that description doesn't fully capture its importance. It is more accurate to think of it as the record of business activity. Without it, there is nothing to analyse.
Each row in a fact table represents a single event at a defined level of detail, commonly referred to as the grain.
Understanding the grain is one of the most important skills in dimensional modelling.
For example, a sales fact table could be designed so that each row represents:
- A customer order
- An individual order line
- A daily sales summary
- A monthly sales summary
Each option is valid, but they answer different questions.
If your users want to know which products were purchased together, storing only monthly totals won't help. That level of detail has already been lost.
Once data has been aggregated, you cannot recover the detail later.
For that reason, experienced data architects almost always model facts at the lowest practical level of detail.
Business Process | Example Grain | Example Measure |
|---|---|---|
Sales | One order line | Sales Amount |
Recruitment | One placement | Placement Value |
Finance | One invoice | Invoice Total |
Manufacturing | One production event | Units Produced |
Customer Support | One support ticket | Resolution Time |
Measures: The Numbers the Business Cares About
Facts usually contain measurable values.
These are often called measures.
Measures answer questions such as:
- How much?
- How many?
- How long?
- How often?
Examples include:
- Revenue
- Quantity sold
- Profit
- Cost
- Margin
- Hours worked
- Number of applications
- Number of placements
These values can normally be aggregated, allowing Power BI or another analytical engine to calculate totals, averages, minimums and maximums quickly.
Dimension Tables: Providing the Business Context
If fact tables answer what happened, dimension tables explain who, what, where, when and why.
Without dimensions, a report showing £14.2 million in revenue tells us very little.
Was that revenue generated this year or last?
Which customers contributed most?
Which products performed best?
Which region underperformed?
Dimensions provide the answers.
Rather than storing descriptive information repeatedly inside the fact table, that information is stored once inside dedicated dimension tables.
Dimension tables are generally wide rather than deep.
A company might have:
- 2,000 customers
- 5,000 products
- 150 employees
- 80 branches
Compared to millions of sales records, these are relatively small tables.
Because they're small, they can contain plenty of descriptive information without causing significant performance issues.
A customer dimension might include:
- Customer Name
- Industry
- Region
- Country
- Customer Type
- Account Manager
- Date Joined
All of these become useful filters within reports.
How Relationships Bring Everything Together
Individually, fact and dimension tables don't achieve very much.
Their real value comes from the relationships between them.
Every sale contains references to a customer, a product, a store and a date.
These references are known as keys.
Rather than storing "Acme Ltd" millions of times, the fact table stores a customer key.
When a report is generated, Power BI follows that relationship to retrieve the descriptive information from the customer dimension.
This approach reduces duplication while ensuring consistency across every report.
You can think of relationships like a library index.
A book doesn't contain the full biography of every author it references.
Instead, it points to an entry elsewhere.
Similarly, the fact table points to dimensions that hold the descriptive information.
This separation keeps the model organised while making updates much easier.
If a customer's industry changes, it only needs updating once in the customer dimension rather than across millions of historical sales records.
Why Single Direction Relationships Usually Win
One of the most common mistakes made by new Power BI developers is assuming that more relationships, or more complex relationships, automatically create a better model.
In reality, the opposite is usually true.
Most star schemas use single direction filtering.
Dimensions filter facts.
Facts do not filter dimensions.
This mirrors how people naturally analyse data.
A user selects a year.
That filters the sales.
They choose a region.
That further narrows the results.
Each filter flows towards the business events being analysed.
Simple filtering behaviour is easier to understand, easier to troubleshoot and typically performs better than complex many-to-many relationships or widespread bidirectional filtering.
Simple Star Schema
- Single direction filtering
- Predictable behaviour
- Easier troubleshooting
- Better query performance
- Easier for new developers to understand
Complex Relationship Model
- Multiple filter paths
- Ambiguous results
- Harder to debug
- Increased risk of circular dependencies
- Greater maintenance effort
Understanding Surrogate Keys
If you've looked at a dimensional model before, you may have noticed columns containing seemingly meaningless numbers such as 10245 or 678901.
These are often surrogate keys.
Rather than relying on business identifiers supplied by operational systems, dimensional models frequently generate their own unique identifiers.
Why?
Because operational systems change.
Customer numbers may be reused.
Product codes can be altered.
Entire systems may be replaced during a migration.
A surrogate key provides a stable identifier that remains under the control of the data warehouse rather than the source application.
This stability becomes particularly valuable when integrating data from multiple systems into a single reporting model.
When Business Information Changes
Businesses rarely stand still.
Customers relocate.
Employees change departments.
Products move into new categories.
Sales territories are reorganised.
If these changes overwrite historical information, reports can quickly become misleading.
Imagine analysing sales from three years ago.
If today's sales region is applied to historical transactions, you may end up attributing past performance to teams that didn't exist at the time.
That makes trend analysis unreliable.
This is why experienced data warehouse designers often use Slowly Changing Dimensions (SCDs).
Rather than replacing historical records, they create new versions of a dimension whenever significant attributes change.
Historical facts continue pointing to the original version, preserving an accurate picture of the business at that point in time.
There are several recognised SCD approaches, but the most common is Type 2, where new rows are inserted with effective dates while older versions remain available for reporting.
For many organisations, this is one of the hidden strengths of dimensional modelling. It allows reports to answer not only "What happened?" but also "What did the business look like when it happened?"
"A good star schema doesn't just describe today's business. It preserves yesterday's truth as well."
Before We Move On
At this point we've explored the two building blocks that make every star schema work.
Fact tables record business events.
Dimension tables describe those events.
Relationships connect them in a way that is intuitive for both users and analytical engines.
On paper, the concept appears deceptively simple. In practice, however, many reporting models fail because these fundamentals are ignored. Tables are connected wherever possible, relationships become increasingly tangled and reports gradually become slower and harder to trust.
In the final part of this guide, we'll look at the mistakes that lead to those problems, examine why star schemas perform so well in Power BI and Microsoft Fabric, explore situations where a star schema may not be the right choice, and finish with practical advice drawn from real consultancy experience.
Common Mistakes That Undermine a Star Schema
A star schema is not difficult to understand, but it is surprisingly easy to get wrong.
Many poor data models don't fail because of the technology. They fail because they try to mirror the source systems instead of the business.
It's a natural instinct. Developers receive dozens or even hundreds of operational tables and assume the reporting model should look similar. Before long, the semantic model resembles a spider's web rather than a star.
Every additional relationship introduces more complexity. Every unnecessary table increases the learning curve. Eventually, simple questions become difficult to answer because nobody is entirely sure how the data fits together.
Good architecture is often about deciding what to leave out.
- Define the grain before importing data.
- Design around business processes, not source tables.
- Create conformed dimensions that can be shared across facts.
- Avoid many-to-many relationships unless there is a genuine business need.
- Keep relationships single direction wherever practical.
- Use meaningful business names rather than technical table names.
- Hide technical keys from report authors.
- Build reusable measures instead of repeating calculations.
- Validate totals against trusted source systems before publishing.
- Document business definitions, not just technical implementation.
Why Star Schemas Perform So Well in Power BI
Power BI is designed to work exceptionally well with dimensional models.
Its storage engine compresses data extremely efficiently, particularly when fact tables contain numeric keys rather than repeated descriptive text. Dimension tables are typically small enough to remain highly compressed while still providing rich filtering capabilities.
This combination allows Power BI to scan millions of rows remarkably quickly.
The result is dashboards that remain responsive even as data volumes continue to grow.
Performance isn't just about speed.
Fast reports encourage exploration.
When filters respond instantly, users naturally ask more questions, compare more scenarios and investigate unexpected trends.
Conversely, if every interaction takes several seconds, curiosity disappears. Reports become static documents rather than analytical tools.
A well-designed star schema helps create an experience where data feels interactive rather than obstructive.
Star Schemas in Microsoft Fabric
Microsoft Fabric hasn't changed the importance of dimensional modelling. If anything, it has reinforced it.
Fabric introduces powerful capabilities such as Lakehouses, Warehouses and Direct Lake semantic models, making it easier than ever to centralise organisational data.
However, simply landing data in a Lakehouse does not create a good analytical model.
The medallion architecture commonly adopted in Fabric illustrates this perfectly.
Bronze layers preserve raw data.
Silver layers clean and standardise it.
Gold layers present business-ready information.
Star schemas are a natural fit for those Gold layers because they provide a trusted, understandable structure for semantic models and self-service reporting.
Technology may evolve, but the principle remains the same: business users should interact with business concepts, not operational databases.
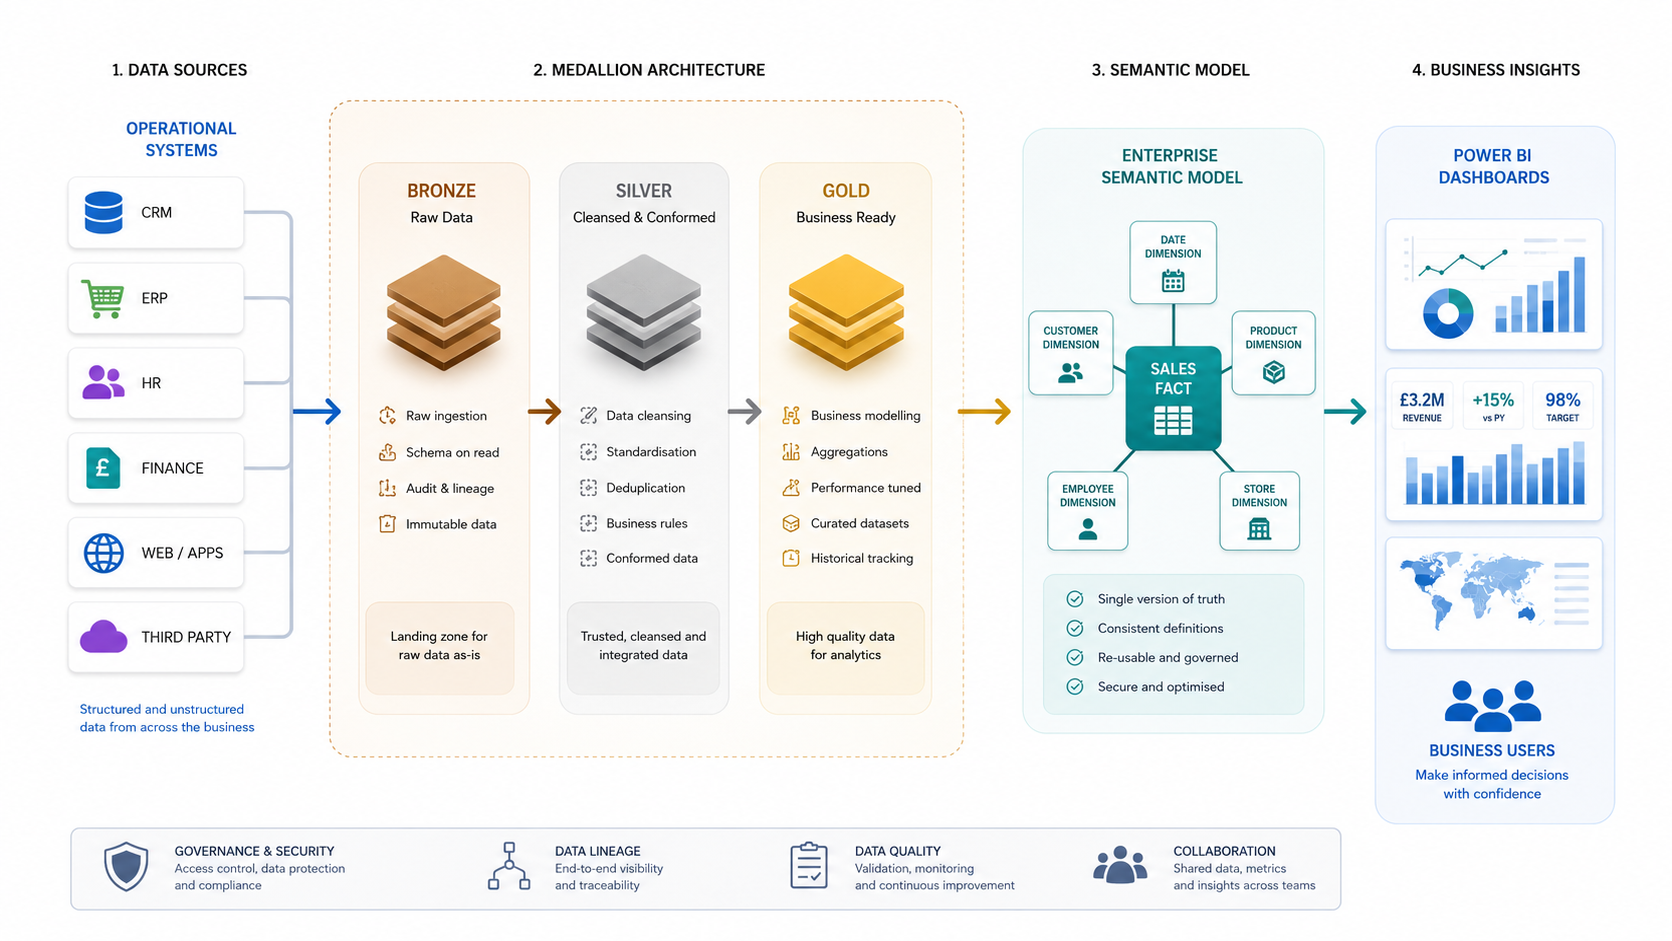
An architectural illustration showing data flowing from operational systems into Bronze, Silver and Gold layers before reaching a semantic model built using a star schema. Business users access Power BI dashboards from the semantic model rather than directly from the source systems.
When a Star Schema Isn't the Right Choice
Like any architectural pattern, a star schema isn't the answer to every problem.
If you're building an operational application where users are constantly inserting and updating records, a highly normalised transactional database remains the better choice.
Similarly, data science workloads often benefit from denormalised datasets or feature stores that have been engineered specifically for machine learning rather than business reporting.
There are also situations where highly detailed exploration requires specialist modelling techniques beyond a traditional star schema.
The important point is that architecture should follow purpose.
Choose the model that best supports the questions you're trying to answer.
A Consultancy Lesson That Never Gets Old
One pattern appears repeatedly on Business Intelligence projects.
A reporting solution begins life with the best intentions. Under pressure to deliver quickly, reports are built directly against operational tables.
Initially, everything appears manageable.
A few reports become twenty.
Twenty become one hundred.
Different developers create their own joins, their own calculations and their own interpretations of the data.
Soon, meetings are dominated by a familiar question.
"Which report is correct?"
By the time an organisation reaches that point, the technical problem is no longer the biggest challenge.
Trust has been lost.
Introducing a well-designed star schema often isn't about improving performance. It's about rebuilding confidence that everyone is working from the same version of the truth.
The organisations that invest in good modelling early rarely regret it.
Those that postpone it usually end up paying the price later.
"Data warehouses should be understandable, navigable and resilient to change."
Conclusion
Star schemas have remained the foundation of Business Intelligence for decades because they solve a timeless problem.
They separate business events from business descriptions in a way that mirrors how organisations think.
That simplicity delivers clarity, consistency and performance all at the same time.
Modern platforms such as Microsoft Fabric, Power BI and cloud data warehouses may offer new storage engines and new architectural capabilities, but they haven't changed the importance of good data modelling.
Technology evolves.
Business questions do not.
Whether you're designing your first semantic model or modernising an enterprise reporting platform, learning to recognise and build effective star schemas is one of the most valuable investments you can make as a Business Intelligence professional.
Frequently asked questions
What is the difference between a star schema and a snowflake schema?
Should every Power BI model use a star schema?
What is the grain of a fact table?
Why are surrogate keys used?
Can a star schema contain more than one fact table?
Why is a date dimension recommended instead of using dates from the fact table?
What are conformed dimensions?
Does Microsoft Fabric replace dimensional modelling?
Key takeaways
- A star schema is designed for answering business questions rather than processing transactions.
- Fact tables record measurable business events.
- Dimension tables provide the descriptive context needed for analysis.
- Defining the grain is one of the most important design decisions.
- Simpler relationship models are usually faster and easier to maintain.
- Conformed dimensions improve consistency across reports.
- Star schemas work particularly well with Power BI and Microsoft Fabric.
- Good dimensional modelling improves trust as much as performance.
- Architecture should always reflect business processes, not source systems.
Fact Tables vs Dimension Tables: The Most Important Decision in Your Data Model
Understanding the difference between facts and dimensions is only the beginning. The next article explores how to identify them correctly, avoid common modelling mistakes and build semantic models that scale with confidence.
Read more