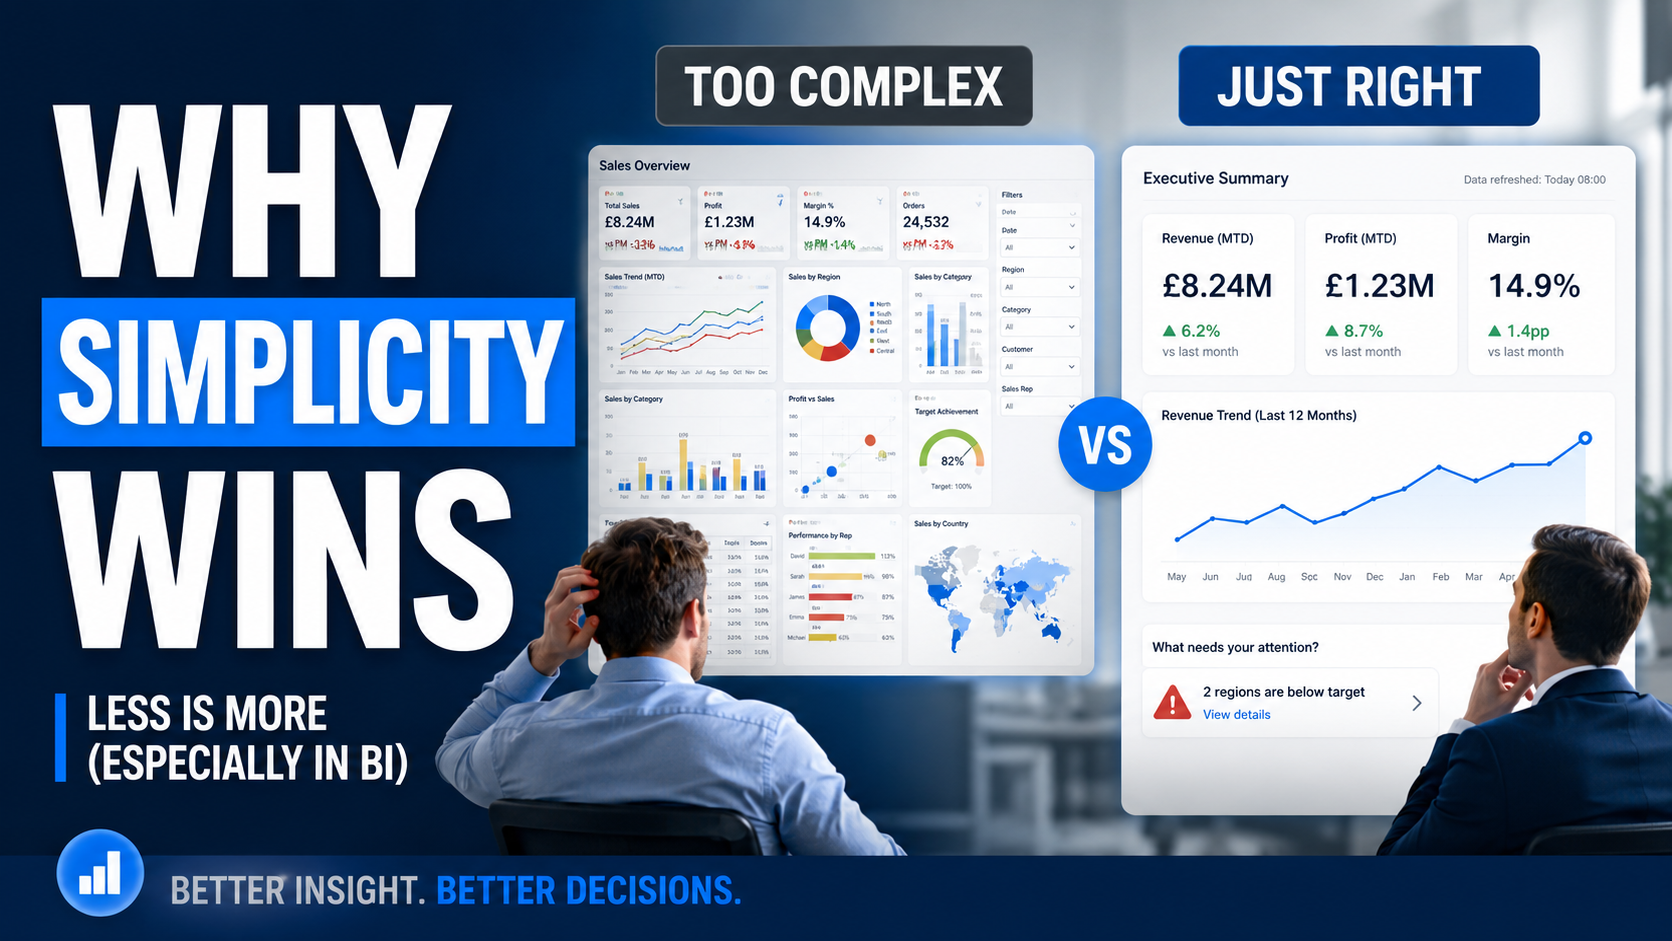
Executive summary
Most organisations do not have a shortage of reports.
They have a shortage of clarity about why those reports exist.
Someone asks for a dashboard. Someone else wants a spreadsheet. A manager needs "a quick report" before a meeting. A director wants the same information with three additional columns. Another team already has a report that looks almost identical, but apparently theirs is "not quite right".
The natural response from a BI team is to start discussing requirements.
What fields do you need? What filters? Which date range? How often should it refresh? Who needs access?
Those are useful questions, but they are not the first questions.
The first question should be:
What decision are you trying to make?
A reporting request is often presented as a technical requirement when it is actually a business problem that has not yet been properly defined.
Sometimes the answer really is a new report. Sometimes it is an existing report that the requester has not found. Sometimes it is a different view of an existing semantic model. Sometimes it is a five-minute conversation, an export, a measure, an alert or a change to an existing dashboard.
And sometimes, after asking the right questions, you discover that nobody actually needs the report at all.
That is not a failure of BI.
It is good BI.
The report is not the requirement
A report is an output.
It is not the business requirement.
The distinction sounds obvious, but it is one of the easiest things to lose when a BI team is busy.
If a sales manager asks for a report showing every open opportunity, the requirement might not actually be "a report of open opportunities". The underlying requirement could be to identify opportunities that have stalled.
If Finance asks for a report showing invoice variances, the requirement may be to find errors before month end.
If Operations asks for a daily staffing report, the actual requirement might be to identify unfilled shifts early enough to take action.
The report is simply one possible mechanism for satisfying the need.
Once you understand that, you have more options.
Perhaps the right solution is an existing dashboard with an additional measure. Perhaps it is an exception report showing only items that need attention. Perhaps it is an automated notification. Perhaps it is a Power BI report built on an existing semantic model. Perhaps the information belongs in an operational application rather than a BI product.
The technology becomes easier to choose once the problem is clear.
- Decision-led reporting
- A reporting approach where the primary purpose of an analytical output is to support a defined business decision, action or process rather than simply present available data.
Five questions before anyone builds anything
- What decision or action will this support? If there is no clear decision or action, challenge whether a new report is necessary.
- Who will use it? Identify the actual audience rather than assuming everyone needs access.
- How often will they use it? Daily, weekly, monthly and one-off requirements are very different products.
- Does this information already exist? Search existing reports, dashboards, semantic models and approved data sources first.
- What is missing from the existing solution? Be specific. Is it a metric, filter, calculation, level of detail, permission or presentation?
- What happens if the information is wrong or late? This helps establish the actual importance and required freshness.
- What action follows the insight? If there is no action, ask whether the report is genuinely useful.
- Could an existing semantic model satisfy the requirement? If the organisation has a governed model, a new report may only require a new presentation layer.
This is particularly important in mature BI environments.
The larger an organisation becomes, the more likely it is that the information someone wants already exists somewhere.
It might be in a corporate report. It might be in a Power BI app. It might be available through a semantic model. It might be in an operational system. It might even be sitting in an Excel file that someone has been maintaining for three years.
The existence of the information is not enough, of course. It needs to be trustworthy, accessible and appropriate for the intended purpose.
But there is an important difference between saying "we do not have this information" and saying "we do not have this information in the format you want".
Those are very different problems.
Reporting-first
- Someone asks for a report
- Requirements are gathered
- Data is sourced
- Logic is recreated
- Report is developed
- Numbers are validated
- Report is published
- Nobody checks whether it is used
- Another similar request arrives later
Decision-first
- A business problem is identified
- The decision or action is defined
- Existing information is reviewed
- Gaps are identified
- The simplest suitable solution is chosen
- Existing governed logic is reused
- Usage and value are reviewed
- The solution is improved or retired
The hidden cost of "just one more report"
A single report rarely causes a problem.
Five similar reports might be inconvenient.
Fifty similar reports become an architecture problem.
Every report creates something that needs to be understood, supported, tested, secured and eventually retired.
It may introduce another set of DAX measures. Another Power Query transformation. Another refresh schedule. Another workspace. Another audience. Another access request. Another explanation of what "revenue" means.
Most importantly, it creates another place where business logic can diverge.
Imagine one report calculates margin using invoiced revenue and another uses recognised revenue. Both are technically correct within their own context. A third report uses a spreadsheet maintained by Finance and produces a slightly different number.
Now the organisation has a reporting problem rather than a data problem.
People start asking which number is correct.
The BI team investigates.
Meetings happen.
Screenshots are exchanged.
Queries are run.
Someone eventually discovers that the three reports are calculating the same business concept in three different ways.
The cost was never the original report.
The cost was the duplication.
3
Sources of truth can become three versions of the truth
A simple example of how duplicated business logic can create conflicting results. One metric implemented in three different reports can produce three different answers, even when all three reports appear reasonable.
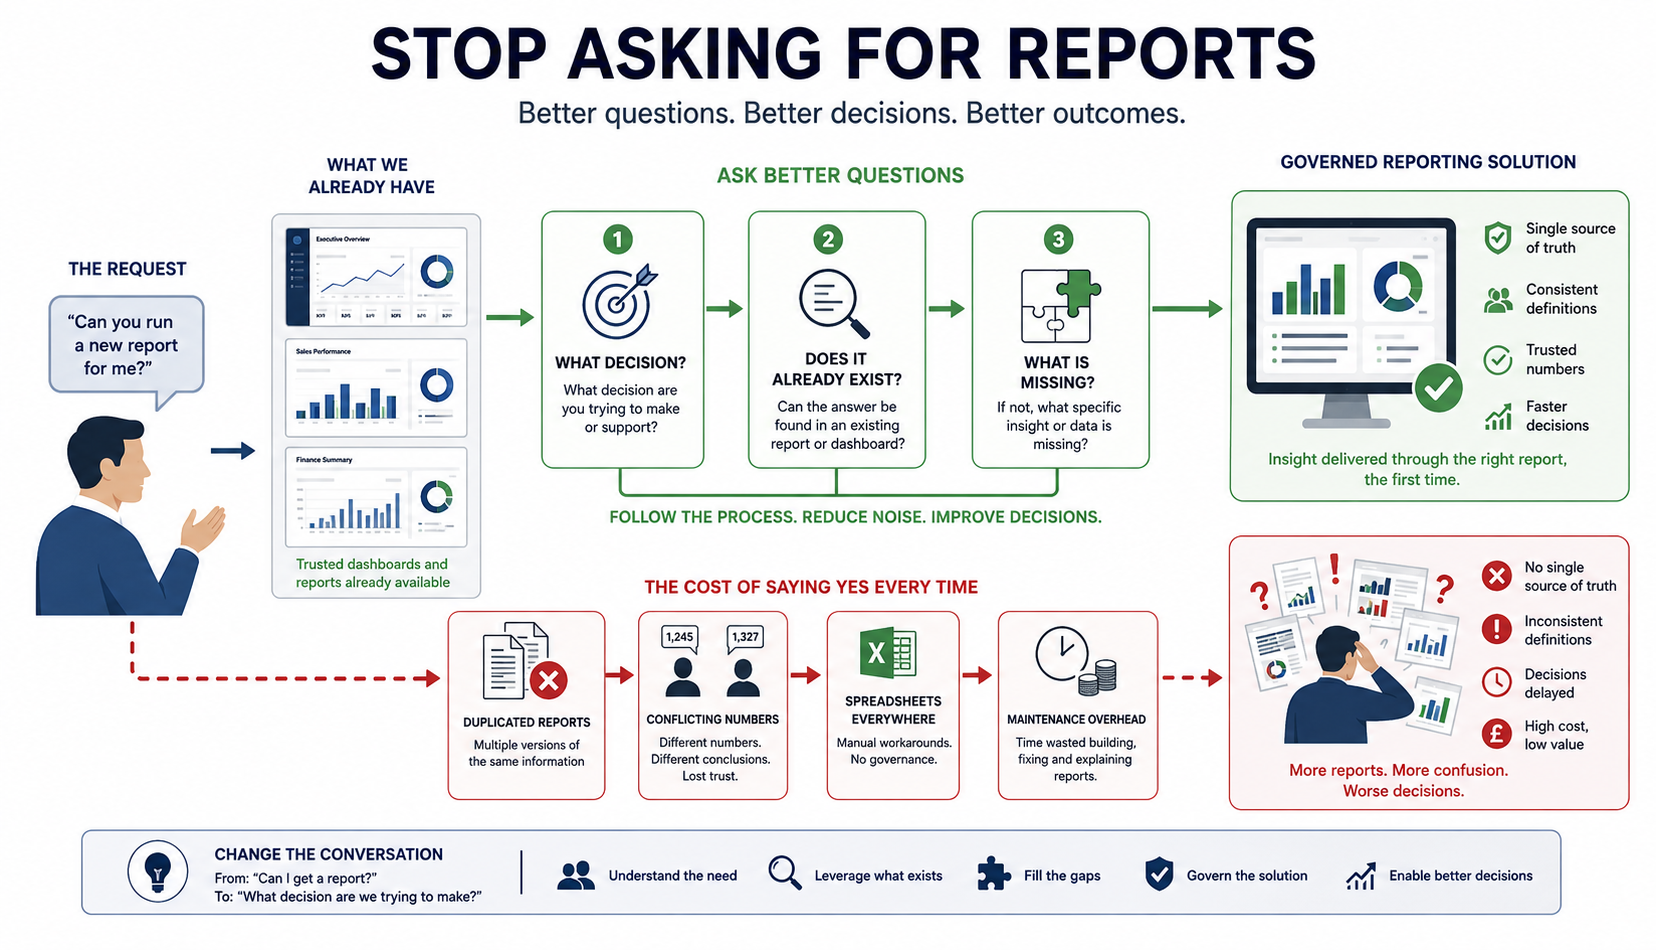
A clean editorial illustration showing a business person asking for a new report on the left, with several existing dashboards and reports already available behind them. The visual should show the progression from "Do we need another report?" through "Does it already exist?" and "What decision will it support?" before reaching a single, well-governed report or semantic model. Include subtle visual cues showing duplicated reports branching into conflicting numbers, contrasted with a central semantic model feeding multiple consistent reports. Modern enterprise BI illustration, white background, restrained professional colours, simple icons, strong visual hierarchy, no generic technology clichés.
Self-service does not mean everyone builds their own data model
This is where modern BI architecture can change the conversation.
Self-service BI is sometimes interpreted as "give everyone Power BI and let them build whatever they want".
That is not self-service BI.
That is uncontrolled reporting.
A better model separates the responsibility for trusted data and business logic from the responsibility for presenting that information.
Microsoft's managed self-service BI guidance describes this principle clearly: centralised teams can develop shared semantic models while report creators build their own reports against those models.
That distinction is extremely powerful.
The organisation can maintain a trusted definition of revenue, margin, headcount, customer, placement or whatever the important business concepts happen to be.
The business user can then create the report they actually need without asking the central BI team to build every variation.
This is not removing governance.
It is moving governance to the right layer.
This is one of the most important architectural ideas in a modern reporting environment.
The semantic model becomes the reusable business layer.
The report becomes a presentation of that model.
That means someone can create a new report without creating a new definition of the underlying business.
Microsoft documents the ability to create Power BI reports from existing semantic models, including semantic models in other workspaces. Users with the appropriate Build permission can reuse the model for their own reports, while security such as row-level security continues to apply.
In Fabric, this can extend naturally into an architecture where governed data is made available through OneLake and shared semantic models. Microsoft describes OneLake as Fabric's unified data lake, with data available across Fabric workloads.
The important point is not the product name.
The important point is the separation of concerns.
Data should be governed once. Business logic should be defined once where practical. Reports can then be created many times.
That is a much healthier model than asking the BI team to build every chart for every person.
Approach | Governance | Flexibility | BI Team Effort | Risk of Duplication |
|---|---|---|---|---|
Centralised reporting only | High | Low to medium | High | Low |
Managed self-service | High | High | Medium | Controlled |
Unmanaged self-service | Low | High | Low initially | High |
Spreadsheet-led reporting | Low | High | Hidden | Very high |
When you really should build a new report
None of this means that new reports are bad.
Sometimes you absolutely should build one.
A new report is justified when there is a genuine information gap, a defined audience and a meaningful business outcome.
For example, imagine an operations team responsible for filling temporary staffing requirements.
They already have a weekly recruitment report. It shows vacancies, candidates and placements.
But they now need to identify assignments where a worker is due to start within 48 hours and critical information is missing.
The existing report is not wrong.
It simply does not answer the new operational question.
A targeted report could be entirely appropriate.
The mistake would be to build another general-purpose dashboard containing every available field because someone asked for "a report on placements".
A good reporting product is specific about the decision it supports.
- There is a clearly defined business problem.
- The audience is known.
- The decision or action is understood.
- Existing reports have been reviewed.
- Existing semantic models have been reviewed.
- The missing information has been identified.
- The required data freshness is understood.
- Security requirements are defined.
- Ownership is agreed.
- The expected usage or value can be explained.
- The solution can be maintained after launch.
- A retirement point or review date can be considered.
Stop accepting "I need it yesterday" as a requirement
"I need it yesterday" is not a useful requirement.
It is an expression of urgency.
There is a difference.
If the Chief Financial Officer needs a number before a board meeting in two hours, that may justify a rapid response. But it does not automatically justify building a permanent report in two hours.
The right response may be to provide a controlled extract from an existing trusted source while the longer-term requirement is understood properly.
This distinction is important because urgency and importance are not the same thing.
A request can be urgent but temporary.
A request can be important but not urgent.
A request can be neither.
The BI team should be able to respond appropriately to all three.
Otherwise every urgent request becomes a permanent reporting asset.
Question
"What are we trying to understand?"
Decision
"What will we do differently?"
Gap
"What is genuinely missing?"
Solution
"What is the simplest suitable output?"
Delivery
"Build, publish and secure it."
Review
"Is it being used and creating value?"
Retirement
"Remove it when it no longer serves a purpose."
Reporting should be a product, not a collection
One of the signs of a maturing BI function is that it stops thinking primarily in terms of reports.
Instead, it starts thinking in terms of data products.
A report is one interface.
Behind it sits a semantic model, which sits on top of governed data, which ultimately comes from operational processes.
If you treat the report as the whole product, you are likely to rebuild logic every time someone asks for something different.
If you treat the semantic model and underlying data architecture as the product, reports become much cheaper to create.
This is particularly relevant in Microsoft Fabric.
Fabric can support semantic models over data held in the platform, including Direct Lake scenarios. Microsoft documents that semantic models with Direct Lake tables can be used to create Power BI reports, explorations and DAX queries.
The technology does not magically create good governance, of course.
Architecture still matters.
Naming still matters.
Relationships still matter.
Measures still matter.
Security still matters.
But once those things are done well, the value of the architecture becomes visible.
The organisation can create multiple reporting experiences without rebuilding the foundations each time.
That is the real opportunity.
Why people keep returning to spreadsheets
There is a reason people keep asking for Excel.
It is not because they enjoy breaking governance.
Excel gives people control.
They can add a column. Change a filter. Combine two lists. Make a calculation. Send the result to someone. They do not have to wait for a BI developer.
If the alternative is submitting a ticket and waiting three weeks for a report, the spreadsheet will win every time.
This is why simply telling people to stop using spreadsheets rarely works.
The better question is:
What are people using spreadsheets to do that the BI environment does not currently let them do easily?
Sometimes the answer is genuinely analytical.
They need to explore the data.
Sometimes they need a different presentation.
Sometimes they need to combine an approved dataset with a small piece of local information.
Sometimes the central reporting platform has simply not provided a good self-service experience.
If the architecture can give users trusted semantic models and allow appropriate self-service analysis, the organisation can reduce the need to create separate copies of the underlying data.
Power BI can support several ways of working with semantic models, including report creation, explorations, paginated reports, DAX queries and Excel-based analysis.
The objective should not be to eliminate Excel.
The objective should be to stop Excel becoming the organisation's unofficial data warehouse.
Spreadsheet-led
- Data is exported
- Logic is recreated locally
- Calculations vary between users
- Copies proliferate
- Refresh is often manual
- Ownership becomes unclear
- Numbers can drift
Governed self-service
- Data comes from trusted sources
- Business logic is reused
- Users create their own analysis
- The semantic model remains authoritative
- Security is centrally managed
- Changes can be governed
- Different reports can still use consistent definitions
The conversation I want BI teams to have
When someone asks for a report, I do not think the right response is "raise a ticket".
Nor is it "yes".
The better response is a conversation.
"Tell me what you are trying to achieve."
"What are you currently using?"
"What is wrong with it?"
"What decision are you trying to make?"
"How often does this happen?"
"Who needs the information?"
"Is there already a semantic model that contains what you need?"
"What would success look like?"
These questions do not create bureaucracy.
They remove it.
They stop the BI team from spending two weeks building something that could have been solved by changing an existing visual.
They also stop the business from waiting for a new dashboard when they already have the information available to them.
That is a much better relationship between BI and the business.
A simple reporting request process
- Capture the problem - Record the business question, not just the requested output.
- Identify the decision - Establish what action the information will support.
- Search first - Check existing reports, apps, semantic models and approved datasets.
- Challenge duplication - Identify similar reports and establish why they are insufficient.
- Define the gap - Document exactly what is missing.
- Choose the least complex solution - Reuse before rebuilding.
- Reuse governed logic - Build from the appropriate semantic model wherever possible.
- Agree ownership - Someone needs to own the business outcome and someone needs to own the technical product.
- Deliver proportionately - Do not turn a one-off question into a permanent enterprise product without a reason.
- Review usage - If nobody uses the report, ask why it still exists.
Frequently asked questions
Are you saying organisations should stop building reports?
What if an existing report contains the information but is difficult to use?
Is self-service BI suitable for everyone?
Does self-service mean users can change the semantic model?
How does this reduce spreadsheets?
What should happen to reports that nobody uses?
What if someone genuinely needs a report urgently?
Why are semantic models so important?
Key takeaways
- A report is an output, not the business requirement.
- Start with the decision or action the information will support.
- Always check what already exists before requesting something new.
- "What is missing?" is usually a better question than "What report do you want?"
- Report proliferation creates maintenance overhead and competing definitions.
- Managed self-service allows users to create their own reporting without forcing them to recreate the underlying data logic.
- A governed semantic model can become the reusable foundation for many reports and analytical experiences.
- Self-service without governance simply moves reporting problems downstream.
- Spreadsheets are often a symptom of insufficient flexibility in the BI environment, not simply a user problem.
- Urgent reporting requests should not automatically become permanent reporting products.
- Good BI is not measured by the number of reports it produces.
- Sometimes the best reporting outcome is deciding that no new report is needed.